
Precedence Research Segment-Share, Company and Lead-Generation Intelligence on the Global BNPL Market
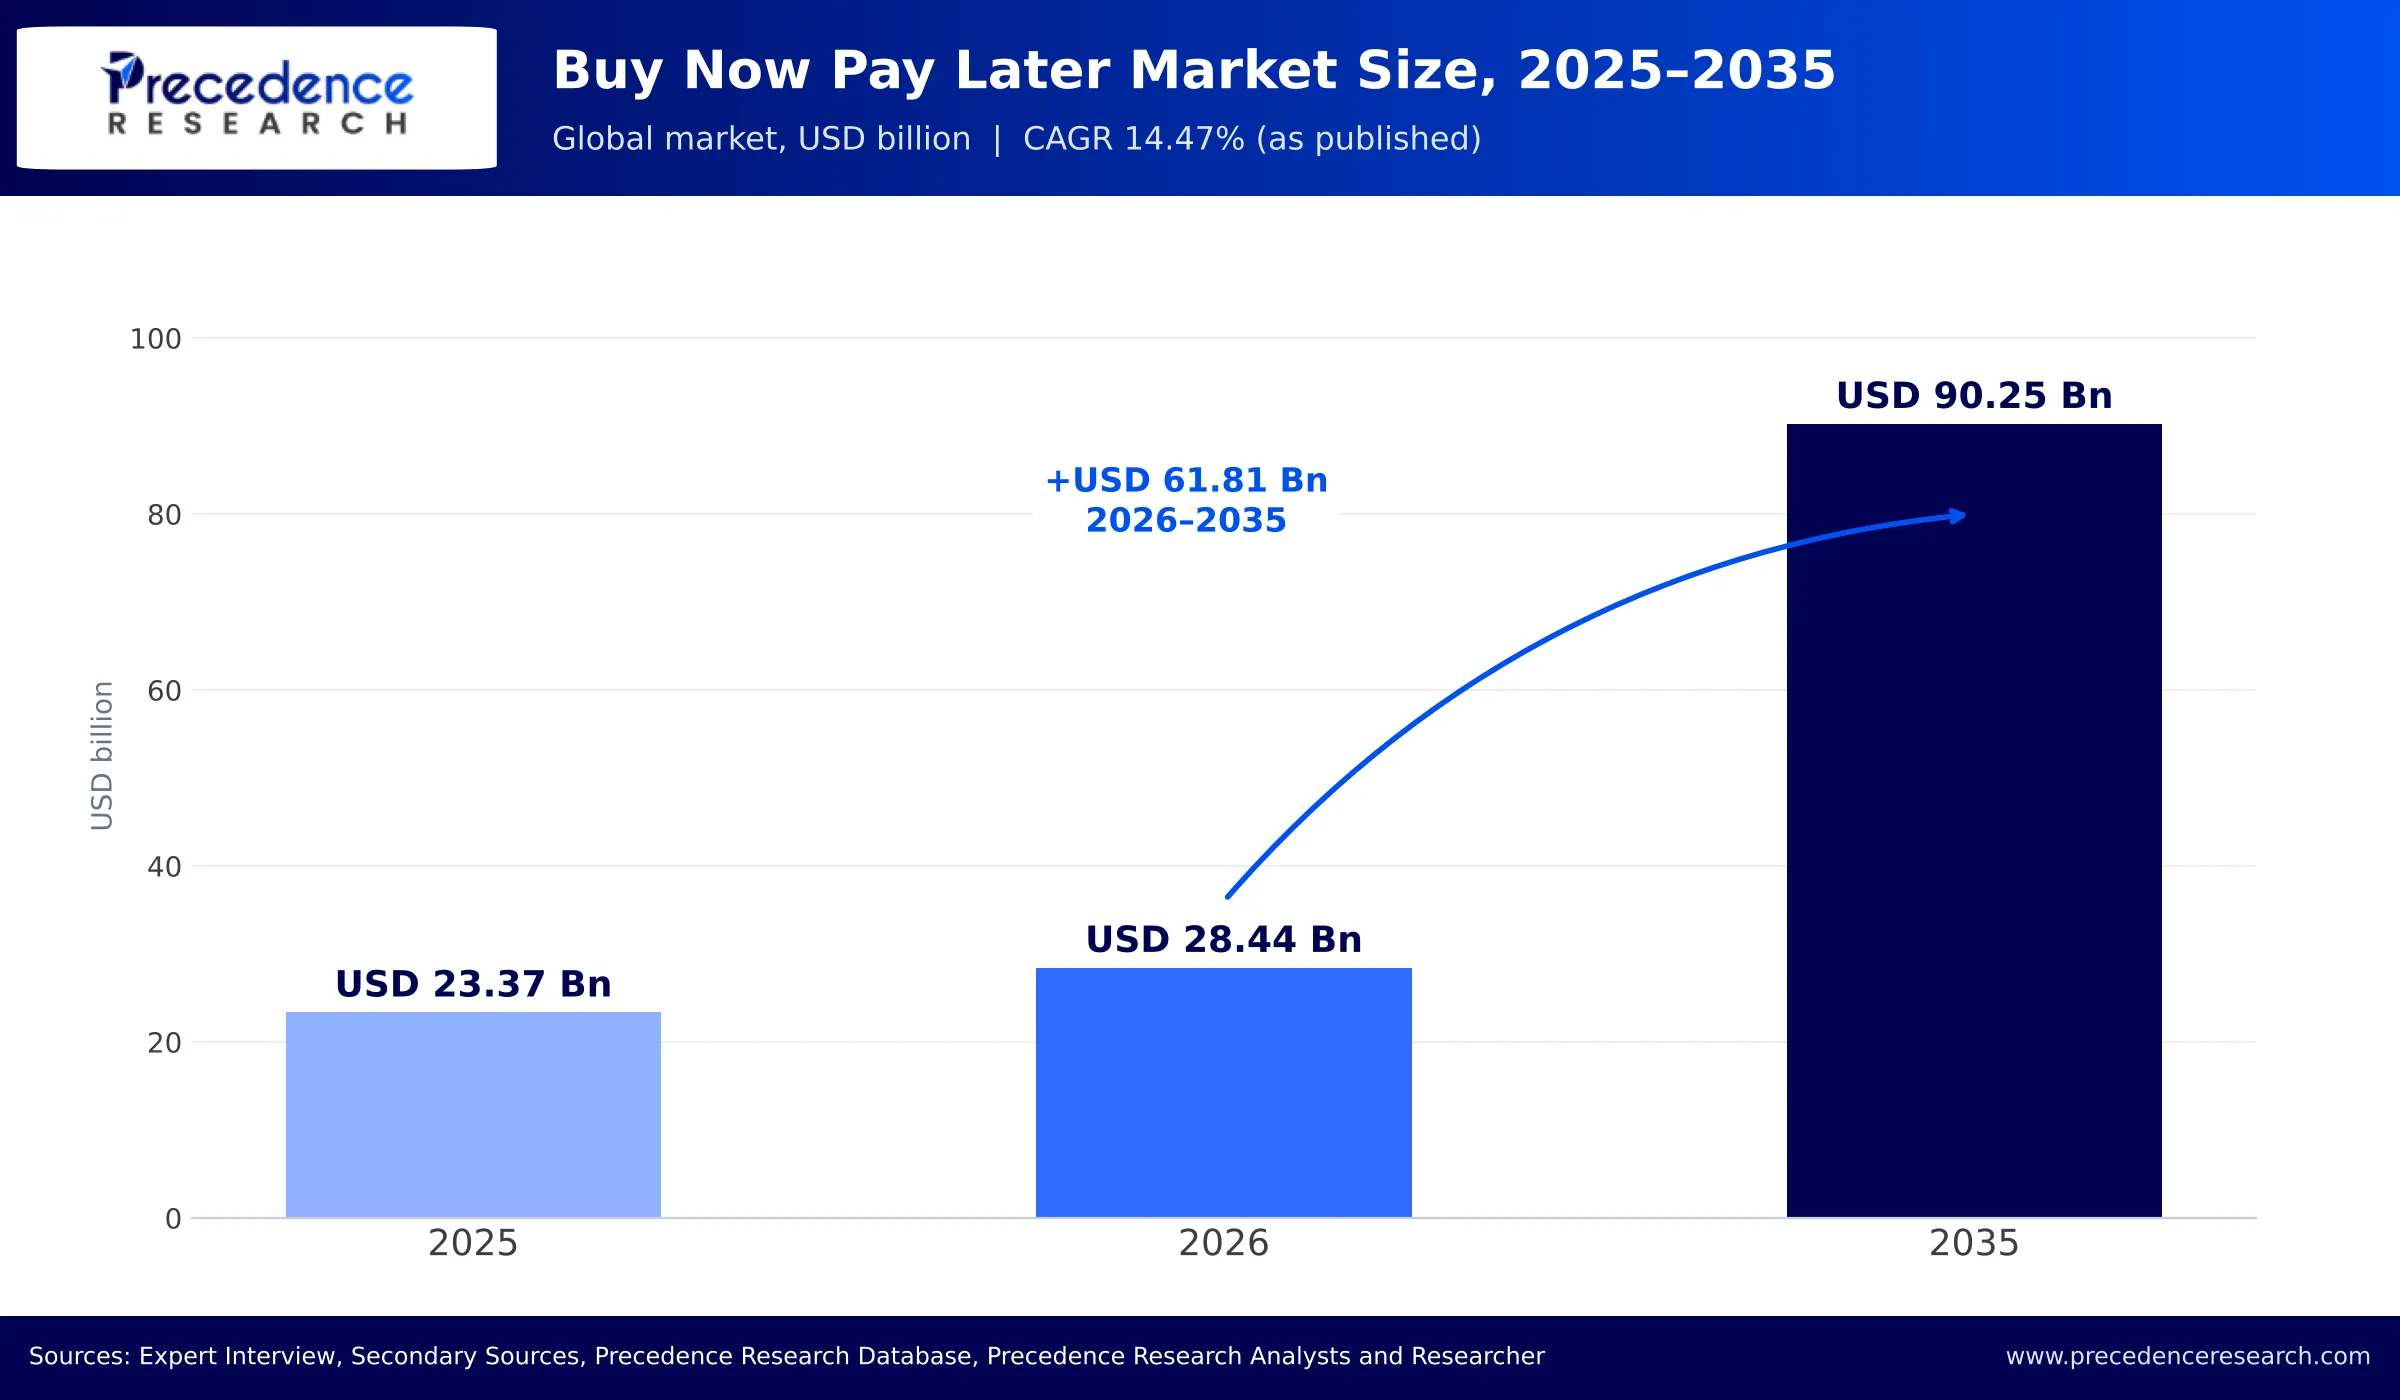
Ottawa, Oct. 28, 2026 (GLOBE NEWSWIRE) -- The global buy now pay later market is valued at USD 28.44 billion in 2026, up from USD 23.37 billion in 2025, and is projected to reach USD 90.25 billion by 2035 at a published CAGR of 14.47%. Asia Pacific leads with a 36.42% share and North America is the fastest-growing region.
Precedence Research today released updated intelligence on the global buy now pay later market. The update combines its official forecast with an assessment of the company, regulatory and funding developments that are changing how installment credit is sold, underwritten and financed. The market is valued at USD 28.44 billion in 2026 and is forecast to reach USD 90.25 billion by 2035. That adds more than USD 61 billion in annual revenue over the forecast period.
The headline growth hides a market in transition. In 2026, buy now pay later (BNPL) moved from a lightly supervised checkout feature to a regulated consumer credit product in several major markets. The largest providers are now competing less on merchant exclusivity and more on distribution through payment processors, card products, bank partnerships and lower-cost funding. For merchants, lenders, payment companies and investors, the commercial question has changed. It is no longer whether to offer BNPL, but which model, partner and funding structure will hold margins as rules tighten.
Get the full report: https://www.precedenceresearch.com/buy-now-pay-later-market
Market Size and Forecast
| Market Indicator | Value |
| Global market size, 2025 | USD 23.37 billion |
| Global market size, 2026 | USD 28.44 billion |
| Forecast market size, 2035 | USD 90.25 billion |
| CAGR, 2026–2035 (as published) | 14.47% |
| Base year | 2025 |
| Largest region, 2025 | Asia Pacific (36.42%) |
| Fastest-growing region | North America (15.11% CAGR) |
| Asia Pacific market size, 2025 → 2035 | USD 8.57 billion → USD 34.23 billion |
Sources: Expert Interview, Secondary Sources, Precedence Research Database, Precedence Research Analysts and Researcher
Figure 1: Buy Now Pay Later Market Size, 2025–2035 (USD Billion)
Sources: Expert Interview, Secondary Sources, Precedence Research Database, Precedence Research Analysts and Researcher
Request a sample: https://www.precedenceresearch.com/sample/1559 | Email: sales@precedenceresearch.com
What supports demand
- Consumers increasingly want interest-free installments for everyday and discretionary spending.
- Merchants use BNPL to lift conversion and average order value.
- BNPL is spreading from online checkout into stores, card products and post-purchase financing.
What constrains it
- Affordability checks and disclosure rules add cost and friction at the point of approval.
- Funding costs remain the main swing factor in provider margins.
- Consumer spending in some core European markets has softened.
The winners through 2035 are likely to combine three things: low-cost funding, strong underwriting data, and distribution through processors and wallets rather than one merchant at a time.
Segment-Share Analysis
The official 2026 market size of USD 28.44 billion is the baseline for every table below. 2025 shares are the figures Precedence Research publishes, or are derived from its published 2025 revenue tables. 2026 shares are modeled estimates by Precedence Research analysts. They roll the 2025 shares forward one year using each segment's published growth rate, or the market average where no rate is published. Segment value = USD 28.44 billion × share ÷ 100.
Figure 2: BNPL Market Share by Component, Business Model, Mode and Ticket Size, 2026
Sources: Expert Interview, Secondary Sources, Precedence Research Database, Precedence Research Analysts and Researcher
Buy Now Pay Later Market by Component: 2026 Share and Market Value
| Segment | 2025 Share | 2026 Market Share | 2026 Market Value |
| Platform/Solutions | 67.0% (published) | 66.7% (modeled) | USD 18.97 billion |
| Services | 33.0% (published) | 33.3% (modeled) | USD 9.47 billion |
Sources: Expert Interview, Secondary Sources, Precedence Research Database, Precedence Research Analysts and Researcher
Platforms remain the core of the market. They carry checkout integration, real-time credit decisions and API-based lending. The services segment is gaining share as merchants and lenders buy risk management, fraud detection, merchant onboarding and repayment analytics rather than building them. This is a natural entry point for technology vendors and managed-service providers.
Buy Now Pay Later Market by Purchase Ticket Size: 2026 Share and Market Value
| Segment | 2025 Share | 2026 Market Share | 2026 Market Value |
| Small ticket (up to USD 300) | 42.98% (published) | 42.7% (modeled) | USD 12.14 billion |
| Mid ticket (USD 300–1,000) | 35.0% (analyst estimate) | 35.4% (modeled) | USD 10.07 billion |
| Higher prime (above USD 1,000) | 22.0% (analyst estimate) | 21.9% (modeled) | USD 6.23 billion |
Sources: Expert Interview, Secondary Sources, Precedence Research Database, Precedence Research Analysts and Researcher
Only the small-ticket share is published. The mid- and higher-ticket split is an analyst estimate based on two inputs: the mid-ticket segment's published 15.84% CAGR, and the product mix disclosed by leading providers, where longer-term and interest-bearing plans carry a large share of volume. Small-ticket use is broadening into groceries and everyday essentials. Mid-ticket is where AI-based affordability models are opening electronics, appliances and travel to installment financing.
Buy Now Pay Later Market by Business Model: 2026 Share and Market Value
| Segment | 2025 Share | 2026 Market Share | 2026 Market Value |
| Business-driven | 70.99% (published) | 70.7% (modeled) | USD 20.11 billion |
| Customer-driven | 29.01% (published) | 29.3% (modeled) | USD 8.33 billion |
Sources: Expert Interview, Secondary Sources, Precedence Research Database, Precedence Research Analysts and Researcher
Merchant-funded, business-driven models still generate most revenue because retailers pay to raise conversion. Customer-driven models are growing faster, at a published 15.49% CAGR. These include app-based shopping, provider-branded cards and post-purchase installment conversion. The shift moves customer ownership from the merchant to the BNPL provider.
Buy Now Pay Later Market by Mode: 2026 Share and Market Value
| Segment | 2025 Share | 2026 Market Share | 2026 Market Value |
| Online | 55.88% (published) | 55.6% (modeled) | USD 15.81 billion |
| Offline | 44.12% (published) | 44.4% (modeled) | USD 12.63 billion |
Sources: Expert Interview, Secondary Sources, Precedence Research Database, Precedence Research Analysts and Researcher
Online checkout remains the largest channel. Offline is the fastest-growing channel because BNPL now reaches stores through point-of-sale systems, QR payments, tap-to-pay cards and processor integrations. Card-linked products are the clearest evidence: one leading U.S. provider reports that its card volume more than doubled year over year.
Buy Now Pay Later Market by Vertical: 2026 Share and Market Value
| Segment | 2025 Share | 2026 Market Share | 2026 Market Value |
| Electronics | 35.94% (published) | 35.9% (modeled) | USD 10.21 billion |
| Fashion | 31.2% (derived) | 31.5% (modeled) | USD 8.96 billion |
| Home & Furniture | 24.4% (derived) | 24.3% (modeled) | USD 6.91 billion |
| Others | 8.4% (derived) | 8.3% (modeled) | USD 2.36 billion |
Sources: Expert Interview, Secondary Sources, Precedence Research Database, Precedence Research Analysts and Researcher
Figure 3: BNPL Market by Vertical, 2026
Sources: Expert Interview, Secondary Sources, Precedence Research Database, Precedence Research Analysts and Researcher
Electronics leads because ticket sizes are high and upgrade cycles are frequent. Fashion is the fastest-growing vertical, at a published 15.53% CAGR, driven by social commerce and frequent purchasing. Home and furniture is attracting new partnerships, including major U.S. home retailers adding installment plans both in store and online.
Buy Now Pay Later Market by Region: 2026 Share and Market Value
| Region | 2025 Share | 2026 Market Share | 2026 Market Value |
| Asia Pacific | 36.42% (published) | 36.5% (modeled) | USD 10.38 billion |
| North America | 29.5% (analyst estimate) | 29.6% (modeled) | USD 8.41 billion |
| Europe | 24.0% (analyst estimate) | 23.8% (modeled) | USD 6.77 billion |
| Latin America | 6.0% (analyst estimate) | 6.0% (modeled) | USD 1.71 billion |
| Middle East & Africa | 4.1% (analyst estimate) | 4.1% (modeled) | USD 1.17 billion |
Sources: Expert Interview, Secondary Sources, Precedence Research Database, Precedence Research Analysts and Researcher
Figure 4: BNPL Market by Region, 2026
Sources: Expert Interview, Secondary Sources, Precedence Research Database, Precedence Research Analysts and Researcher
The Asia Pacific share is published. Shares for the other regions are analyst estimates based on reported regional volumes of the largest listed providers and the published regional growth rankings.
Technology, Product and Application Analysis
Underwriting is the main point of difference. Providers are moving from static credit scores to real-time models built on transaction histories and behavior. One leading U.S. lender put a transformer-based underwriting model into live checkout in September 2026, designed to approve applicants with thin or no credit files. Better approvals at stable losses translate directly into merchant conversion and revenue.
Cards and wallets are replacing one-off checkout buttons. Provider-branded cards let consumers split purchases anywhere the card is accepted, which turns BNPL into a daily payment habit. Integration with mobile wallet and contactless payment ecosystems widens reach without new merchant contracts.
Processor distribution is now the fastest route to merchants. Integrations with large acquirers and payment gateway platforms allow merchants to switch on BNPL without a separate build. This lowers acquisition cost for providers but weakens exclusivity.
New use cases are emerging. These include B2B invoicing and procurement, healthcare and education payments, travel, and larger-ticket financing. Each carries different risk, regulation and pricing, so vertical specialists have room to compete.
Current Developments, Investments and Commercial Implications
Regulation went live in the UK and is arriving in the EU. The UK brought deferred payment credit under Financial Conduct Authority regulation on 15 July 2026, following final rules published in February 2026. Lenders must be authorised or in the temporary permissions regime, run affordability checks and meet disclosure standards. The revised EU Consumer Credit Directive applies across member states from 20 November 2026 and brings most BNPL products within EU consumer credit law.
Commercial impact: Compliance, credit data and decisioning costs rise; scaled, well-capitalised providers gain an advantage; and merchants must offer an alternative payment method when an application is declined.
Klarna is trading volume for margin. Klarna reported second-quarter 2026 GMV of USD 36.6 billion, up 18%, with U.S. GMV up 27% and revenue up 27% to USD 1.042 billion. Provisions fell to 0.52% of GMV. It cut full-year 2026 GMV guidance to USD 149–151 billion, citing weaker German spending and currency effects, while raising its transaction-margin outlook. It went live with J.P. Morgan Payments in the U.S. in August 2026 and announced a Fiserv Commerce Hub partnership in October 2026.
Commercial impact: Distribution through processors is now a central growth lever, and roughly 90% deposit funding gives Klarna a cost edge.
Affirm passed USD 50 billion in annual GMV. For the fiscal year ended June 30, 2026, Affirm reported GMV of USD 50.2 billion, up 37%, revenue of USD 4.26 billion and about 571,000 active merchants. It guides to more than USD 64 billion in GMV for fiscal 2027. Recent wins include Amazon in the UK (September 2026), Crate & Barrel (September 2026) and an exclusive Sam's Club deal (October 2026).
Commercial impact: Large-merchant wins remain decisive, and Affirm's card is turning occasional users into frequent ones.
PayPal is scaling BNPL off its balance sheet. PayPal reported BNPL volume growth of 26% in the second quarter of 2026. In November 2025, it renewed its agreement with KKR, under which KKR's credit funds can buy up to EUR 65 billion of PayPal's European BNPL receivables through March 2028.
Commercial impact: Private-credit funding lets PayPal grow volume without tying up capital, and signals strong investor demand for BNPL receivables.
Grab announced a deal to buy control of Atome. In September 2026, Grab agreed to acquire a 60% stake in Atome Financial for USD 1.49 billion in cash, including USD 260 million of growth capital. The first phase is expected to close by the third quarter of 2027, subject to regulatory approval. Grab also agreed to buy the remaining 40% about two years after closing, at an equity value between USD 2 billion and USD 4.5 billion.
Commercial impact: Super-apps are buying lending capability rather than building it, raising the competitive bar across Southeast Asia.
Specialists are growing fast and attracting capital.
- Sezzle reported second-quarter 2026 GMV of USD 1.3 billion (up 37.9%) and revenue of USD 149.7 million (up 51.7%).
- Zip reported fiscal 2026 U.S. TTV growth of 42.5% in U.S. dollars, with the U.S. now about 76% of group volume.
- Split Pay raised USD 125 million in 2026 to bring installments to large household expenses.
- Stitch launched a merchant BNPL product in South Africa in May 2026.
Sources: Expert Interview, Secondary Sources, Precedence Research Database, Precedence Research Analysts and Researcher
Pricing, Costs, Supply and Profitability
BNPL economics depend on four variables: merchant fees, consumer interest and fees, credit losses and funding cost. Merchant commissions typically range from about 2% to 7% of transaction value. Reported take rates vary widely by model:
| Company | Reported Economics Metric | What It Shows |
| Affirm | Revenue of about 8.5% of GMV; interest-bearing loans about 70% of FY2026 GMV | Interest income supports higher yield |
| Klarna | Transaction margin guided at about 1.09% of GMV for 2026 | Scale and deposit funding offset thin margins |
| Sezzle | Revenue yield near 11.4% (H2 2026 outlook); provisions 2.5–3% of GMV | Subscriptions lift yield but carry higher losses |
| Zip | Cash net transaction margin of about 3.9% in FY2026 | Pay-in-X margin after losses and funding |
Sources: Expert Interview, Secondary Sources, Precedence Research Database, Precedence Research Analysts and Researcher
These are company metrics, not market averages, but they show where value sits. Interest-bearing and subscription products support higher yields. Pay-in-4 relies on merchant fees and tight loss control. Funding is the main lever on cost: deposit-funded lenders and receivable-sale models have a structural advantage over providers that depend on warehouse lines. New affordability checks in the UK and EU will raise decisioning costs and may lower approval rates at first, putting pressure on smaller lenders' margins.
Company Intelligence and Competitive Positioning
Figure 5: Buy Now Pay Later Company Ecosystem, 2026
Sources: Expert Interview, Secondary Sources, Precedence Research Database, Precedence Research Analysts and Researcher
| Company | Core Market Focus | Competitive Positioning | Relevant Development or Opportunity |
| Klarna | Global pay-later, card and shopping app | Deposit-funded, broad merchant network | Processor launches; lower 2026 GMV guidance |
| Affirm | U.S., Canada, UK installment lending | Interest-bearing loans, card, large merchants | GMV above USD 50 billion; Sam's Club, Amazon UK |
| PayPal | Global wallet with Pay Later | Huge installed account base | BNPL volume +26%; KKR receivables deal |
| Block (Afterpay) | Pay-in-4 via Cash App and Square | Merchant and consumer ecosystem | Cross-selling into Square sellers |
| Sezzle | U.S. pay-later and subscriptions | High-yield subscription model | Raised FY2026 guidance; new cash products |
| Zip | U.S. and ANZ installments | Fast U.S. growth via wallets and Stripe | FY2027 U.S. TTV growth guided above 30% |
| Splitit | Card-linked installments | White-label for banks and platforms | Jack Henry and Shopline integrations |
| Atome (Grab) | Southeast Asia BNPL and lending | Super-app distribution once deal closes | USD 1.49 billion stake; close expected Q3 2027 |
| Tabby | GCC BNPL and cards | Regional scale; Saudi listing signalled | Product expansion beyond checkout |
| Tamara | Saudi and GCC Shariah-compliant BNPL | Large debt funding capacity | USD 2.4 billion facility (2025) |
| Paidy (PayPal) | Japan post-pay | Local merchant partnerships | Japan e-commerce penetration |
| Stitch | South Africa payments | Merchant payments platform | BNPL launched May 2026 |
Sources: Expert Interview, Secondary Sources, Precedence Research Database, Precedence Research Analysts and Researcher
No company market shares are given. Provider GMV is not comparable to market revenue as defined in the report.
Regional and Country-Level Opportunities
North America is the fastest-growing region. Strong e-commerce, card-linked BNPL and processor distribution drive demand. Competition centers on large-retailer exclusivity, as Walmart, Amazon and Sam's Club show, and on underwriting for thin-file consumers. U.S. regulatory direction remains less settled than in Europe.
Europe is entering its compliance phase. The UK now requires authorisation and affordability checks, and CCD2 takes effect from November 2026. Germany remains a core market but showed weaker consumer spending in 2026. Providers with credit-bureau links and compliant disclosures should gain share.
Asia Pacific leads in revenue. India's growth is shaped by RBI digital-lending directions and enforcement against non-compliant operators. Southeast Asia is consolidating around super-apps, as the Grab–Atome deal shows. Japan and Australia offer mature but competitive opportunities.
Latin America benefits from low credit card payments penetration and a deep installment culture, especially in Brazil, plus fast-growing digital wallets.
Middle East & Africa is led by Saudi Arabia and the UAE, where licensed providers have raised large funding. South Africa is an emerging market for processor-led BNPL.
B2B Lead Generation and Target-Account Intelligence
| Target Account Group | Relevant Decision-Makers | Purchase or Expansion Signals | Potential Commercial Opportunity |
| Large retailers and marketplaces | CFO, Head of Payments, CMO | Checkout redesign, exclusivity renewals | Provider selection, conversion benchmarking |
| Payment processors and acquirers | Chief Product Officer, BD Director | New BNPL integrations, platform launches | Partner mapping, merchant demand sizing |
| Banks and card issuers | Head of Cards, Chief Strategy Officer | Installment features, white-label programmes | Bank-led BNPL entry strategy |
| BNPL providers and fintechs | CEO, CRO, Head of Expansion | Licensing, new markets, product launches | Market entry, competitor benchmarking |
| Private credit and ABS investors | Investment Director, Portfolio Manager | Receivable sales, warehouse facilities | Credit-performance and volume outlooks |
| Credit-data, fraud and AI vendors | Sales Director, Product Head | Regulation dates, affordability mandates | Target lists of lenders needing compliance tools |
| Electronics, furniture and travel merchants | eCommerce Director, Finance Head | Ticket-size growth, cart abandonment | Vertical-specific financing strategies |
| B2B platforms and invoicing software | VP Partnerships, Product Manager | Embedded payments roadmaps | Trade credit and B2B BNPL opportunity sizing |
Sources: Expert Interview, Secondary Sources, Precedence Research Database, Precedence Research Analysts and Researcher
Precedence Research helps teams turn these signals into pipeline. It does this by prioritising accounts by demand and readiness, benchmarking competitors, mapping partner ecosystems, sizing regional demand and building target lists for account-based sales.
How Precedence Research Supports BNPL Decisions
- Master Dataset: structured market, segment, regional and company data for BNPL and adjacent digital payment and embedded finance markets.
- Precedence Quadrant: comparative positioning of providers on scale, growth, funding and product breadth.
- Interactive Intelligence Dashboard: live tracking of GMV, regulation milestones and partnership activity.
- Quality & Manufacturing Intelligence: supplier and technology-vendor intelligence covering underwriting, fraud and checkout infrastructure.
- Customized Research: tailored work on specific countries, verticals, competitors, buyers or business questions.
Updates are available monthly, quarterly, every six months or annually. Monthly or quarterly tracking suits BNPL, where regulation dates, provider guidance and merchant deals change quickly.
Outlook and Strategic Implications
Through 2035, companies should monitor:
- regulatory implementation in the EU and any U.S. federal or state action;
- funding costs and receivable-sale capacity;
- credit losses as approvals widen to thin-file consumers;
- the share of volume moving through cards and processors versus direct checkout;
- consolidation in Asia and the Middle East; and
- growth in mid-ticket, fashion and B2B use cases.
- Merchants should treat BNPL as a portfolio of providers and test conversion by provider and ticket size.
- Lenders must invest in compliant decisioning and lower-cost funding.
- Payment companies can capture value as distribution layers.
- Investors should weight funding structure and loss performance as heavily as volume growth.
The market's next phase will reward providers that combine regulatory readiness, efficient capital and broad distribution. Continuous, segment-level intelligence is now a requirement for competing in it.
Fill out the form for relevant samples, case studies, and examples. You can also contact Precedence Research to discuss a customized intelligence requirement at sales@precedenceresearch.com.
- Report: https://www.precedenceresearch.com/buy-now-pay-later-market
- Request a sample: https://www.precedenceresearch.com/sample/1559
- Schedule a meeting: https://www.precedenceresearch.com/schedule-meeting
- Email: sales@precedenceresearch.com
Related Reports
- Digital Payment Market: https://www.precedenceresearch.com/digital-payment-market
- Mobile Payments Market: https://www.precedenceresearch.com/mobile-payments-market
- Payment Gateway Market: https://www.precedenceresearch.com/payment-gateway-market
- Mobile Wallet Market: https://www.precedenceresearch.com/mobile-wallet-market
- Contactless Payment Market: https://www.precedenceresearch.com/contactless-payment-market
- Credit Card Payments Market: https://www.precedenceresearch.com/credit-card-payments-market
- Embedded Finance Market: https://www.precedenceresearch.com/embedded-finance-market
- Fintech as a Service Market: https://www.precedenceresearch.com/fintech-as-a-service-market
- Proximity Payment Market: https://www.precedenceresearch.com/proximity-payment-market
- P2P Payment Market: https://www.precedenceresearch.com/p2p-payment-market
- Credit Risk Assessment Market: https://www.precedenceresearch.com/credit-risk-assessment-market
- E-commerce Market: https://www.precedenceresearch.com/e-commerce-market
- B2C E-Commerce Market: https://www.precedenceresearch.com/b2c-e-commerce-market
- Business-to-Business E-commerce Market: https://www.precedenceresearch.com/business-to-business-e-commerce-market
- Artificial Intelligence in E-commerce Market: https://www.precedenceresearch.com/artificial-intelligence-in-e-commerce-market
- Generative AI in E-Commerce Market: https://www.precedenceresearch.com/generative-ai-in-e-commerce-market
- Online Grocery Market: https://www.precedenceresearch.com/online-grocery-market
- Smartphones Market: https://www.precedenceresearch.com/smartphones-market
- Digital Trust Market: https://www.precedenceresearch.com/digital-trust-market
- Contactless Biometrics Technology Market: https://www.precedenceresearch.com/contactless-biometrics-technology-market
About Precedence Research
Precedence Research is a global market intelligence and consulting company. It provides market sizing and forecasts, competitive and company analysis, customer and buyer intelligence, and customized research across healthcare, ICT, automotive, chemicals and materials, energy, consumer goods and other industries. Its analysts help executives, strategy teams and investors make evidence-based decisions on market entry, growth and competitive positioning.
Our Partners
- Towards Healthcare: https://www.towardshealthcare.com/
- Towards Packaging: https://www.towardspackaging.com/
- Towards Chemical & Materials: https://www.towardschemandmaterials.com/
Connect With Us
- USA: +1 804 441 9344
- APAC: +61 485 981 310
- India: +91 87933 22019
- Singapore: +65 3105 1271
- Europe: +44 7383 092 044
- Email: sales@precedenceresearch.com
Social Media








Comments (0)
Login to join the conversation
Login / RegisterNo comments yet. Be the first to comment!